AI Observability Platforms Compared for Enterprise Use
Most AI observability tools miss what enterprises actually need to govern and audit.
Getting a 200 OK back from an AI agent and getting the right answer out of it are two different claims, and most observability tools only check the first one. That gap, between "the request completed" and "the output was safe, accurate, and inside policy," separates developer-grade monitoring from enterprise-grade observability. This piece compares the platforms enterprises actually put in procurement documents against the criteria that matter for that distinction: governance, audit logging, identity integration, cost telemetry, and runtime threat detection. Research and Markets sized LLM observability at $1.97 billion in 2025, headed for $6.8 billion by 2029. That's a market that hasn't found its footing. That's a market that already decided this isn't optional.
What the enterprise evaluation frame looks like, and why it differs from developer-focused reviews
Most published comparisons of AI observability tools grade on ease of instrumentation, SDK language coverage, eval frameworks, and how clean the dashboard looks. Fair enough, if a small team is picking a tool on a Tuesday afternoon. None of that is what a procurement committee cares about when the tool needs to survive a compliance audit or a regulator asking pointed questions on a Thursday.
Enterprise buyers need five things a developer-focused review rarely asks about, and most vendor demos rarely volunteer. Governance and audit logging means tamper-evident records of every agent action, prompt, and tool call, queryable the moment compliance comes asking. Identity integration means the platform plugs into existing enterprise identity systems rather than demanding its own separate login system nobody asked for. Real-time threat detection means catching prompt injection and blocking PII leaks at the point the agent acts, not in a report generated the next morning. Cost and usage telemetry means token spend broken down by team, by role, by workflow, with alerts before the budget quietly evaporates. Deployment model means SaaS, VPC, or fully on-premises, each carrying its own compliance baggage under SOC 2, HIPAA, or GDPR.
These five don't trade off cleanly against each other, and that's the part procurement teams keep missing. A platform can have gorgeous eval dashboards and still produce nothing a legal team would accept as an audit trail. Another can log every token that ever passed through the system and still have zero ability to stop a bad output before a customer sees it. Every platform below gets measured against this same five-part frame, because that's the only way the comparison stays honest instead of turning into a features bake-off.
The shadow AI problem that makes governance and audit logging non-negotiable
A global study from the University of Melbourne and KPMG, covering 48,340 workers across 47 countries, found that 57% of employees hide their AI use from their employer, and 48% have uploaded company data to public AI tools. That's an error too large to be a rounding error. That's roughly half the workforce running a shadow IT department out of a browser tab, one incognito window at a time.
Harmonic Security scanned 22.4 million enterprise AI prompts in 2025 and found 579,113 sensitive data exposures spread across 665 different generative AI tools. Nearly 98,000 of those, about 16.9%, happened on personal free-tier accounts that IT has no visibility into at all. Source code, legal documents, and financial projections made up more than 80% of everything exposed. Customer PII and payment card numbers got pasted into chatbots routinely, the digital equivalent of faxing medical records to a stranger because the fax machine happened to be closer than the mailbox.
The trend is worsening. The 2026 IBM Cost of a Data Breach Report found that 43% of breached organizations traced incidents to shadow AI, more than double the 20% recorded the year before, and shadow AI incidents added roughly $670,000 to the average breach cost. Breaches across the board still average 247 days to detect and contain.
An observability tool that only writes traces after the fact doesn't touch any of this. Ask a vendor directly, in the demo, whether the platform detects unsanctioned tool use as it happens, enforces access policy at the agent layer, and produces records a compliance officer can actually use in front of a regulator. Governance and observability used to sit in separate tabs on separate dashboards. They don't anymore, and any vendor still selling them as two products is selling last year's architecture at this year's prices.
How the six most-compared platforms perform against enterprise criteria
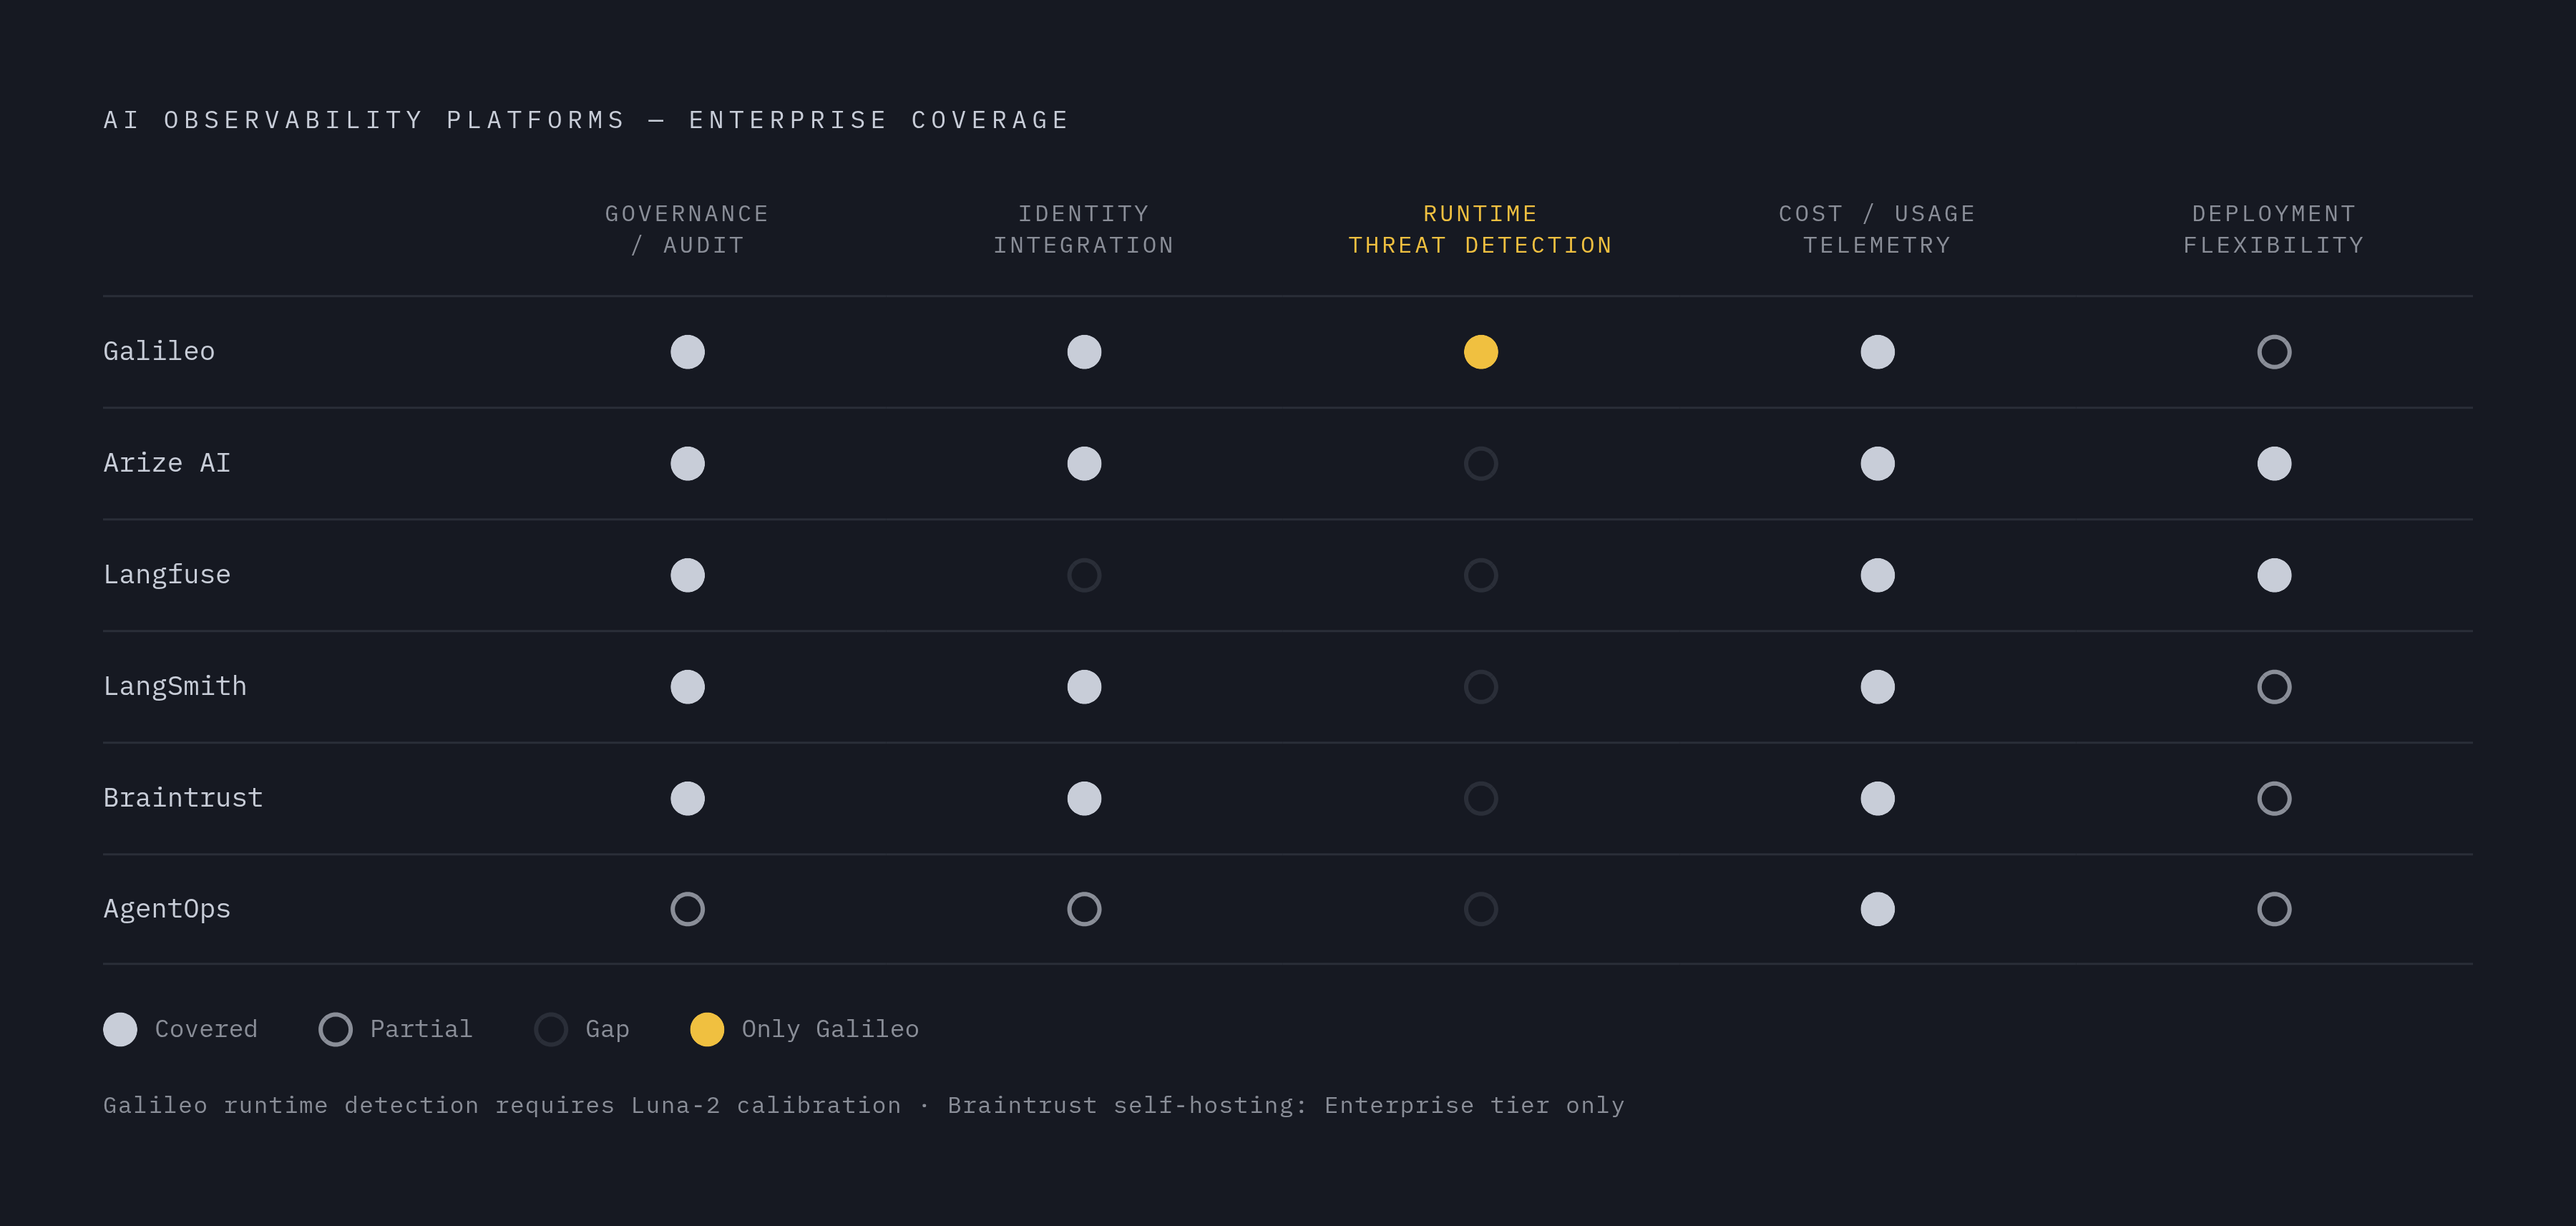
The field narrows fast once governance and runtime protection get added to the checklist. Six platforms come up constantly in enterprise comparisons: Galileo, Arize AI, Langfuse, LangSmith, Braintrust, and AgentOps. Maxim AI rounds out a seventh, with a full-stack pitch distinct enough to deserve its own look.
Galileo leans hardest into runtime protection: catching prompt injection, blocking PII leaks, and intercepting hallucinations before they reach a user, not after a postmortem gets written. Its proprietary eval models, branded Luna-2, hit 95% F1 accuracy at $0.02 per million tokens, against roughly $5.00 for GPT-4o doing the same job. That price gap starts to matter once eval runs continuously in production instead of as a one-off test before launch. Galileo also tracks agentic metrics built for actual debugging, things like Action Completion, Tool Selection Quality, and Reasoning Coherence, rather than a binary pass or fail that tells a team nothing about why something broke. Deployment covers SaaS, VPC, and full on-premises, with SOC 2 Type II compliance for regulated industries, and it's OpenTelemetry-native, so it slots into existing pipelines instead of replacing them. The tradeoff: Luna-2's thresholds need real domain-specific calibration before the guardrails stop throwing false positives at everyone. Best fit is an enterprise that wants observability, evals, and runtime defense in one place and can't afford the latency of stitching three separate tools together.
Arize AI, through its Phoenix product, is built on OpenTelemetry from the ground up, which matters to teams that refuse to lock into a proprietary telemetry format. It runs multiple eval modalities and supports self-hosted deployment, a natural extension for organizations that already have MLOps infrastructure and just need it to reach LLMs. Role-based access control, audit trails, and compliance tooling are built for regulated industries, and Arize is one of the few platforms here that clearly checks that box. Self-hosted deployment options matter a lot to data-residency-sensitive teams. The agent graph visualization is basic rather than a headline feature. Best fit: organizations extending existing MLOps governance to cover LLMs, not starting from zero.
Langfuse is fully open-source under MIT license and self-hostable without restriction, which gives enterprises with strict data-residency rules maximum control over where traces actually live. It supports OpenTelemetry, tracks token costs automatically, and covers tracing, prompt management, and multi-turn evaluation. What it doesn't have: built-in runtime guardrails, native identity-provider integration, or integrated CI/CD tooling out of the box. Self-hosting also means someone's DevOps team now owns one more piece of infrastructure to keep alive. Best fit: teams that want open-source flexibility and full control over their data, and are willing to build the rest themselves.
LangSmith, from LangChain, is the natural pick for teams already living inside the LangChain and LangGraph ecosystem. Agent graph visualization is native for LangGraph specifically, less so anywhere else. Eval automation runs through built-in automation and online evaluators. On-premises support is limited, similar to Arize's constraint, and threat-detection capabilities are not a focus of the platform. Best fit: earlier-stage deployments already committed to LangChain.
Braintrust built an end-to-end loop where production traces become eval cases with one click, and eval results post straight to GitHub pull requests. Its AI gateway gives one OpenAI-compatible API across OpenAI, Anthropic, and Google models, with every call traced and cached automatically. Trace logging is exhaustive out of the box: duration, time to first token, tool calls, prompt tokens, cached tokens, reasoning tokens, estimated cost, no manual instrumentation required. A feature called Topics continuously classifies every production trace by intent, sentiment, and issue, so quality trends surface across all traffic rather than only the failures someone happened to flag. Pricing starts free (1 GB of data, 10,000 scores, 14-day retention), moves to $249 a month at the Pro tier (5 GB, 50,000 scores, 30-day retention), and Enterprise is custom. Below Enterprise, it's hosted SaaS only, and self-hosting requires the top tier, a real constraint for regulated buyers who don't get to negotiate that away. There's no runtime guardrail layer here either. Best fit: teams shipping AI products to real users who want a tight loop from production data back into evals, paired with a separate threat-detection tool if that's a requirement.
AgentOps centers on session replay, a step-by-step execution graph that shows exactly what an agent did during a run, distinct from the decision-path visualizations in Galileo or LangSmith. It supports OpenTelemetry and stays framework-agnostic. On-premises deployment and runtime intervention aren't part of the picture, and RBAC or deep audit trail features aren't documented at the depth Arize or Galileo offer. Best fit: teams whose main debugging need is replaying exactly what an agent did, step by step, after something goes sideways.
Maxim AI takes the full-stack view: experimentation, simulation, evaluation, and production observability under one roof. Teams using it reportedly shipped agents more than five times faster, largely because its simulation environment tests agents against hundreds of scenarios and personas before anything reaches production, catching trajectory-level failures instead of just bad final outputs. Its evaluation framework mixes deterministic checks, statistical methods, and LLM-as-a-judge scoring, configurable at the session, trace, or span level, and it builds in human evaluation workflows for last-mile quality checks. SDKs cover Python, TypeScript, Java, and Go, a wide net for polyglot engineering teams. Maxim also runs Bifrost, an AI gateway that unifies LLM routing, MCP tool execution, and agent infrastructure behind one governed layer, and it holds up under load: 11 microseconds of added latency per request at 5,000 requests per second in sustained testing. Best fit: cross-functional teams that want simulation before launch and observability after it, in the same platform, without a handoff between two vendors.
Where infrastructure and APM vendors fit, and where they fall short of AI-specific requirements
Four names come up constantly when enterprise teams ask "can't we just use what we already have": Datadog, New Relic, Dynatrace, and Splunk. Honestly, it applies only partly, and that gap is the whole point.
Datadog makes the most sense for large enterprises that already run it for infrastructure monitoring and want one pane of glass across servers and AI systems, instead of onboarding a brand-new vendor for a brand-new problem. What it doesn't have documented at the level of purpose-built tools: AI-specific runtime guardrails, prompt injection detection, or agentic eval frameworks.
New Relic has pushed further into AI territory than Datadog, combining compound AI and agentic AI features to predict anomalies, automate root cause analysis, and tie technical performance to business metrics. It offers natural language querying across hybrid cloud environments, a genuine usability win for non-engineers who need to poke around the data themselves without learning a query language. Still, it's an APM platform extending into AI. Nobody built it agent-first from day one, and that shows in the seams.
Dynatrace, through its Davis AI engine, handles automatic anomaly detection and root-cause analysis well for infrastructure that behaves predictably. One third-party source claims it struggles with statistical drift detection and AI-specific relationship mapping, though Dynatrace's own documentation now describes exactly those capabilities. Whoever wins that particular argument, the deeper issue stands regardless: Davis AI was designed around deterministic infrastructure patterns, and LLMs don't produce deterministic output by nature. Same input, different answer, every time. That's a property of the model, not a bug in Dynatrace's code, and it's a mismatch with a monitoring philosophy built for systems that behave the same way twice.
Splunk remains excellent at ingesting and searching log data at scale, and its ML Toolkit adds anomaly detection and predictive analytics on top of that foundation. But for AI workloads specifically, it lacks purpose-built statistical tooling, and comprehensive model monitoring gets described in comparisons as complicated, limited, and expensive once it scales past a pilot.
All four share the same structural blind spot: they can tell a team that something broke. They can't tell it why, because none of them were built with the business, data, and governance context an AI agent actually operates inside. The realistic setup for most enterprises pairs APM with an AI observability layer instead of trying to replace one with the other. Running both, side by side, each doing the job it was actually built for, beats forcing one tool to do a second job it was never designed for.
Why real-time threat detection belongs inside the observability layer, not outside it
Bolting a security tool onto an observability platform after the fact works about as well as installing a smoke detector in the neighbor's house. Technically, there's a smoke detector. It just isn't going to help anyone standing in the actual fire. Real-time threat detection has to live inside the same layer watching decision paths and tool calls, because a prompt injection attack and a bad tool-selection decision often look identical in the first few milliseconds. Only a system with context on both can tell them apart before either one reaches a user.
That's the throughline here. Traditional APM tools report success when a request completes, even when the completion is a hallucinated answer or a tool call gone sideways in a way nobody notices until Monday. Peer-reviewed research cited by Galileo found that 68% of deployed autonomous agents execute ten or fewer steps before needing a human to step in, a number conventional latency and error-rate dashboards never surface, because nothing in that chain technically failed. The agent just made a bad call, politely, on schedule, at full speed.
Non-deterministic systems break pass/fail monitoring by design. The same prompt run twice can produce two different reasoning paths and two different tool choices, and monitoring built for deterministic software has no vocabulary for that kind of variance. Logs alone can't tell a bad model output apart from a poor retrieval step, a failed tool call, or a badly written prompt; they just show that something, somewhere, didn't go as planned. What enterprise teams actually need to trace is the decision path itself: tool-selection quality, reasoning coherence, whether context degraded over a long multi-turn session. None of that shows up on a latency graph, no matter how long someone stares at it.
The question enterprises are asking has changed, and not subtly. It used to be "is the AI working." Now it's "is the AI working well, safely, and within policy," and that second question needs a different category of tool entirely, one where governance, audit logging, and runtime threat detection aren't separate purchases bolted on after a breach, but the same system, watching the same traffic, in real time.