OpenTelemetry Instrumentation for LLM and Agent Workloads
How to monitor LLM systems when traditional APM tools can't track tokens or hallucinations.
A production LLM system fails in ways a stack trace can't explain. Same prompt, different output twice in a row. A single request that costs forty times the average and nobody notices because request-rate dashboards don't measure tokens. This is the gap OpenTelemetry's GenAI work exists to close, treating language models as a genuinely new kind of system to observe.
Traditional application performance monitoring runs on an unstated assumption: a system given the same input produces the same output, throws the same exception, and leaves the same stack trace behind. That assumption is why APM tools spent two decades getting good at latency percentiles and error-rate alerts. None of it holds for a large language model. Send the same prompt twice at a moderate, non-zero temperature setting and get two different completions back. A failure can't be reproduced unless the exact input, the model parameters, and the sampling temperature at call time were all captured at the moment things went wrong. Cost and latency stop tracking request count and start tracking token count instead: a single "slow" call might chew through a context window ten times the size of a normal one, and a monitoring setup built around requests per second is structurally blind to that. Add in multi-step agent chains, where one user request can trigger a chain of LLM calls, tool calls, and vector database lookups, and a single error metric can no longer even tell you which of six steps broke. Then there's the fact that prompts routinely carry personal data, medical information, or confidential business context, so piping raw prompt text into a third-party observability backend without sanitizing it first is a compliance problem waiting to be discovered by an auditor rather than an engineer.
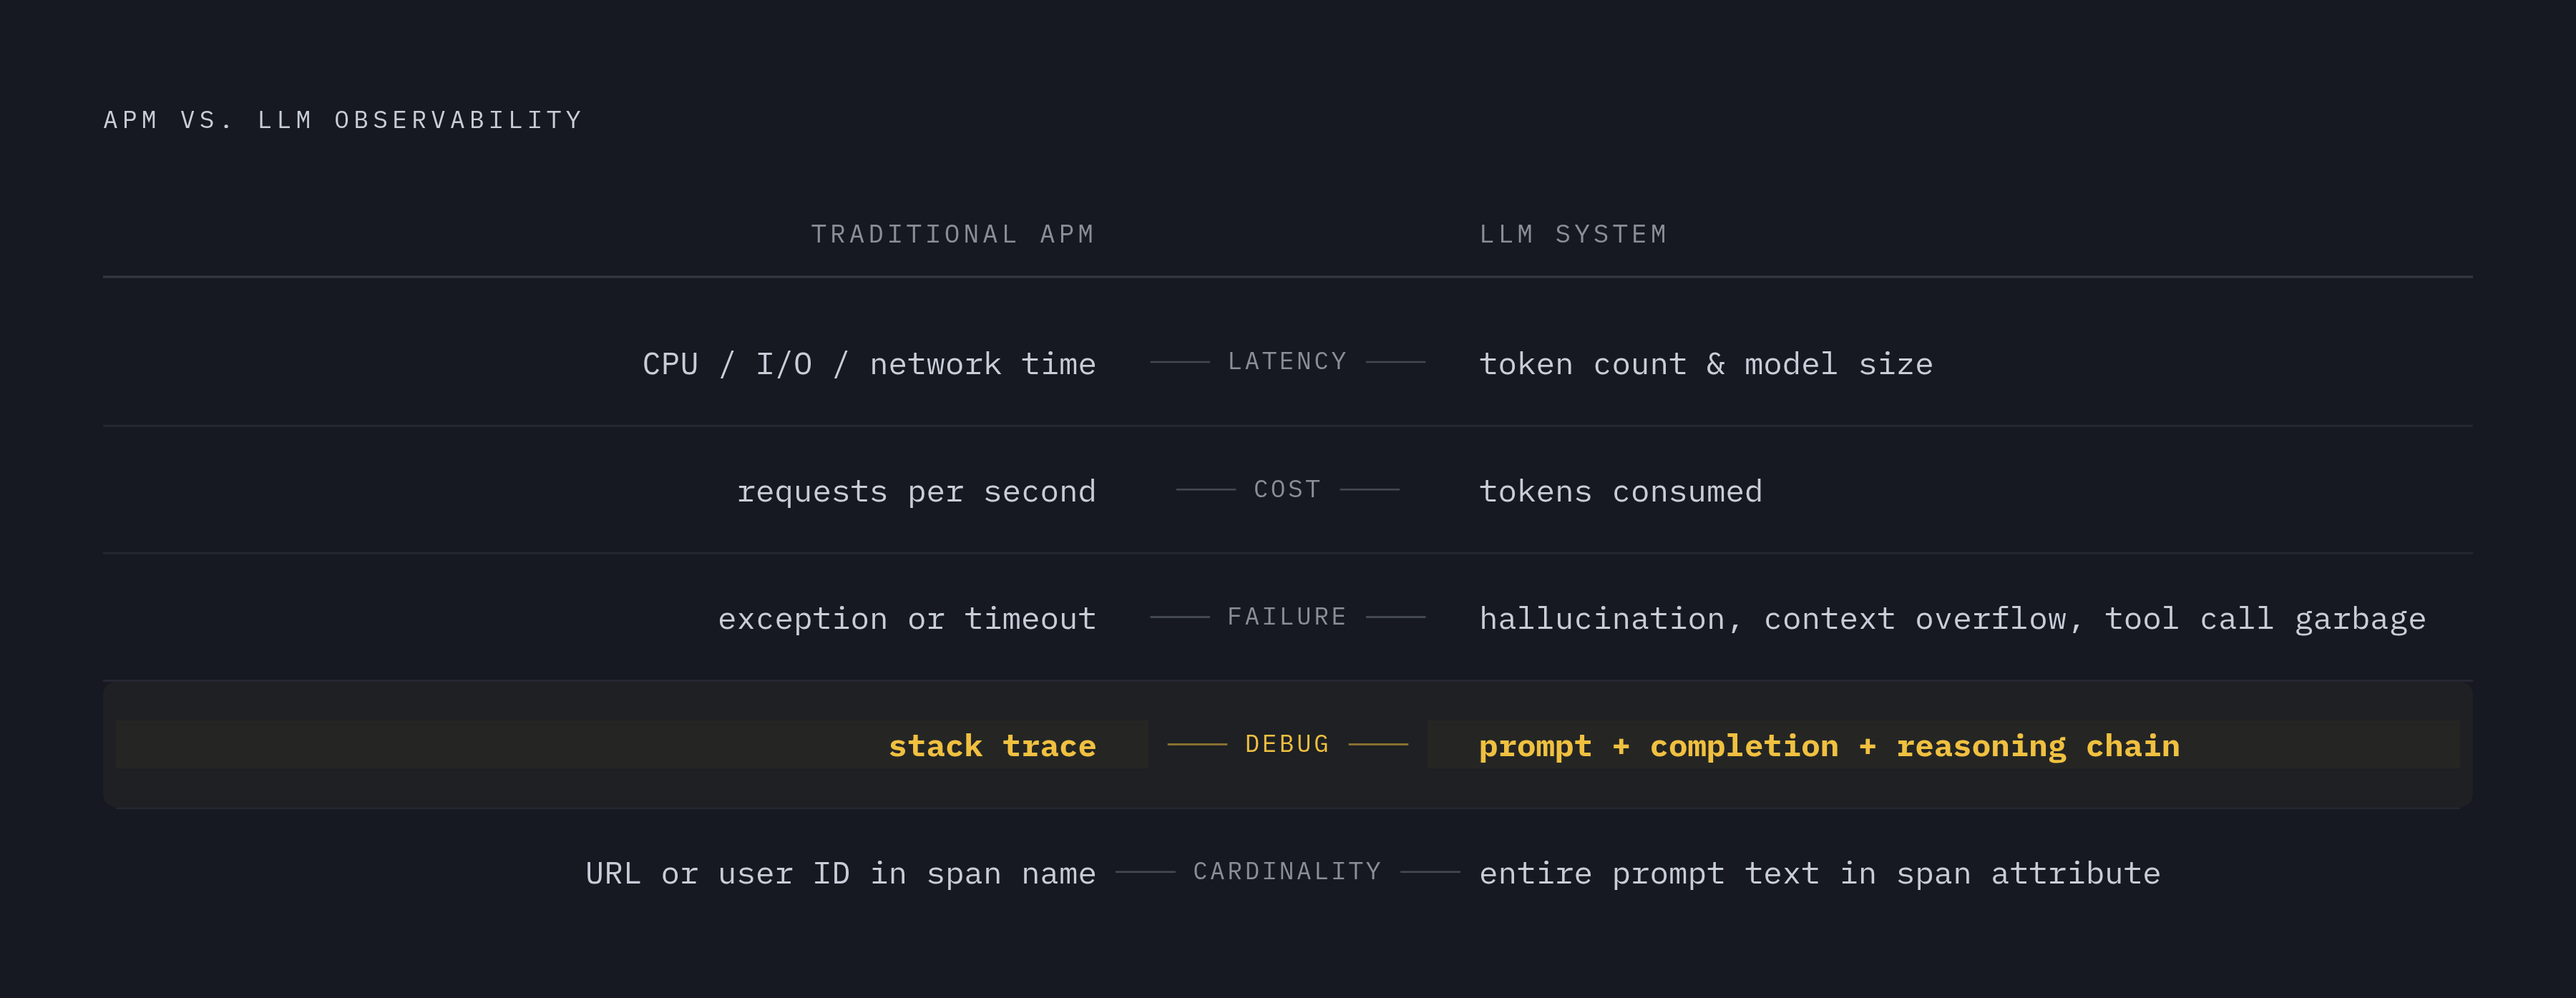
Lining those two worlds up side by side makes the mismatch concrete. Traditional APM measures latency in CPU, I/O, and network time; LLM latency tracks token count and model size instead. Cost used to mean requests per second; now it means tokens consumed, and those two numbers move independently of each other. Failure used to mean an exception or a timeout; now it also means a hallucination, a context window overflow, or a tool call that returned garbage, none of which throws an exception. The debug artifact used to be a stack trace; now it's the prompt, the completion, and the reasoning chain that connects them. And cardinality risk, which used to mean not putting a raw URL or user ID into a span name, now means not putting an entire prompt's worth of text into a span attribute, which is a much easier mistake to make and a much more expensive one to leave in production.
None of this is a hypothetical problem for a handful of AI labs. Sixty-six percent of organizations are already running generative AI workloads on Kubernetes. The telemetry gap described above isn't an edge case; it's the default state of most production AI deployments right now. Token consumption, model version drift, agent decision traces: these are signals that traditional APM tooling was never built to collect, because none of it existed as a category when that tooling was designed.
The foundation OpenTelemetry provides and its limits
OpenTelemetry is a CNCF project and an open, vendor-neutral standard for capturing traces, metrics, and logs, and it graduated within the CNCF in May 2026, marking a significant milestone for its role in cloud-native observability. The pitch for platform teams is simple: instrument once, route anywhere. The OTel Collector sits in the middle of that pipeline as a single governed choke point, the one place where sensitive prompt content gets redacted, spans get tagged with environment and team metadata, and signals get routed to whichever backend needs them, all before any of it leaves the network.
The three signal types map onto LLM workloads differently than they do for a typical web API. Traces follow a user query through every stage of a pipeline: retrieval, prompt construction, model inference, response parsing, each one a span with a clear parent-child relationship to the others. Metrics become histograms over token usage, latency distribution, and cost, and none of that is derivable from an HTTP status code the way infrastructure metrics often are. Logs turn into structured records of decisions, tool arguments, and policy checks, functioning less like an error log and more like an audit trail.
What OTel deliberately leaves alone matters just as much. It does not score whether a model's output was faithful to its source material, does not detect toxicity, and does not assess content quality: those require a separate evaluation layer sitting on top of OTel's data plane, not baked into the collection standard itself. Safety scoring and policy compliance checks aren't part of the GenAI semantic conventions either. OTel builds the pipe. What flows through it and how good that content is remains somebody else's job.
The GenAI semantic conventions: what they standardize, what stability status they carry
A standards effort within a telemetry framework defines a set of standard gen_ai.* attribute names so that telemetry from any LLM provider or framework lands in a backend without custom parsing logic bolted on for every vendor. As of commit c739977 in the OpenTelemetry semantic conventions repository, every GenAI document carries a Status of Development, not Stable, so attribute names can still shift. That's a significant detail, since attribute names can still shift. It means attribute names can still shift, and any team building production pipelines against these conventions needs tooling that can absorb a rename without falling over.
The core attributes to know by name are gen_ai.system identifies the provider (openai, anthropic, gcp.vertex_ai), gen_ai.operation.name identifies the operation type (chat, embeddings, create_agent, invoke_agent, execute_tool, retrieval, among others, though text_completion is among the predefined values). gen_ai.request.model records the model that was asked for, while gen_ai.response.model records the model that actually answered, and those two can differ. gen_ai.request.temperature and gen_ai.request.max_tokens capture the sampling parameters that caused the run to be non-reproducible. gen_ai.usage.input_tokens and gen_ai.usage.output_tokens are the two numbers every cost calculation downstream is built from. And gen_ai.response.finish_reasons records why generation actually stopped, whether that's hitting a token limit, a stop sequence, or something less clean.
Tracing planning, tool use, and MCP calls: how agent operations extend the conventions
Agents complicate the picture further, because a single agent turn isn't one model call, it's a sequence of decisions. The conventions account for this with dedicated operation names: create_agent, invoke_agent, plan, invoke_workflow, execute_tool. Planning, delegation to sub-agents, and tool invocation all get consistent names regardless of which framework produced them, which matters enormously once a team is running LangChain in one service and CrewAI in another and trying to trace both the same way.
Each of those operations produces its own child span, and the resulting trace isn't a single flat LLM call anymore, it's a tree. A user request comes in at the root, the agent plans, the plan branches into one or more tool calls, and each of those branches has its own latency, its own failure mode, its own outcome. The execute_tool span in particular carries gen_ai.tool.name, gen_ai.tool.call.id, and a tool type field, which turns what used to be an opaque function call into something an engineer can actually click into and inspect on its own.
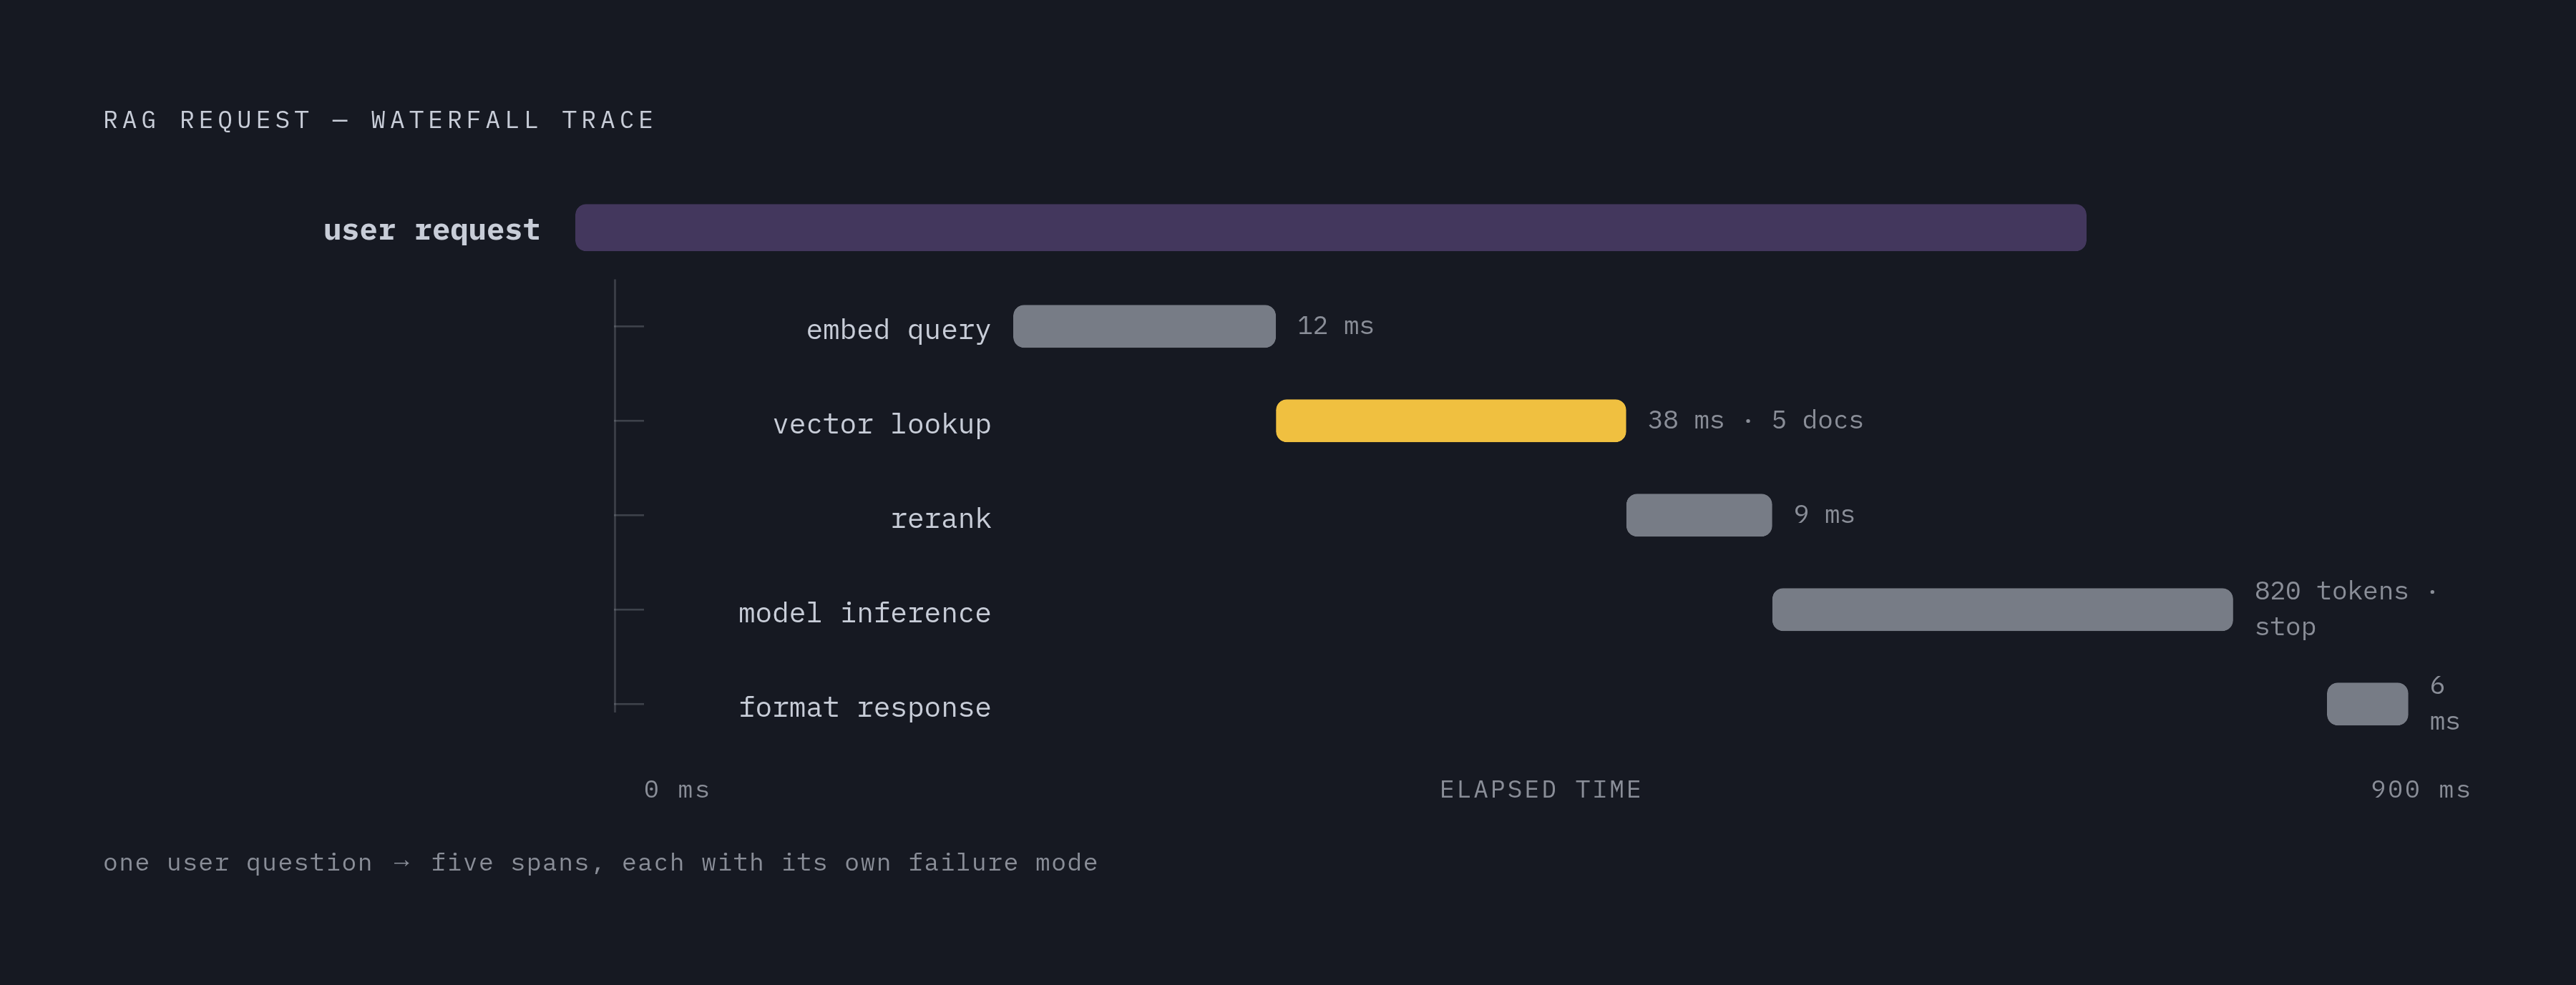
Retrieval-augmented generation pipelines show this waterfall most clearly. A single user question can produce a span for embedding the query, a span for the vector store lookup (carrying metadata like source, document count, and lookup latency), a span for the model inference itself with its token counts and finish reason attached, and additional spans for surrounding pipeline stages. Multiple spans, one user question, and if something goes wrong the trace tells you exactly which of the five stages it happened in, rather than leaving an engineer to guess between "the retrieval was bad" and "the model hallucinated" with no way to tell which.
Auto-instrumentation versus manual spans: when each approach applies
Auto-instrumentation is the fast path, and for good reason: it requires zero changes to business logic. Packages like opentelemetry-instrumentation-openai, opentelemetry-instrumentation-anthropic, opentelemetry-instrumentation-langchain, and opentelemetry-instrumentation-llamaindex get called once at startup, before any client objects are created, and from that point on every API call through those libraries gets traced automatically, gen_ai.* attributes and token counts included. Several agent frameworks, including LangChain, CrewAI, AutoGen, and AG2, either emit OTel-compliant spans natively or do so through one of these packages.
Auto-instrumentation has a ceiling, though. It can't create a span for a custom retrieval step that doesn't go through a supported library, can't attach an evaluation score to a trace on its own, and has no way of knowing about a business logic gate that routes one request to a larger model and another to a smaller model based on some internal policy check. Multi-model orchestration, where the parentage between spans needs to be set deliberately rather than inferred, also falls outside what auto-instrumentation can reach.
That's where manual instrumentation earns its keep: custom retrieval logic, evaluation scores like faithfulness or toxicity attached as span attributes (this is the bridge between raw OTel traces and whatever evaluation layer sits above them), policy gates, and orchestration across multiple models where span structure needs explicit control. The pattern in code is straightforward: open a span with something like tracer.start_as_current_span("gen_ai.chat"), set the relevant gen_ai.* attributes on it, and record the prompt itself as a span event rather than a span attribute, a distinction that matters more than it sounds like it should.
Two libraries in the wider ecosystem are worth knowing by name here. Arize AI's OpenInference, released under Apache 2.0 and documented in Wang et al.'s 2025 paper, is described by its maintainers as built on OpenTelemetry, and in August 2026 Dynatrace signed a definitive agreement to acquire Arize. Traceloop's OpenLLMetry, also Apache 2.0, is referenced in the same paper as a comparable approach. Neither replaces the core gen_ai.* conventions; both extend them for teams that want tracing tuned specifically for LLM evaluation workflows.
The decision rule is not complicated. Start with auto-instrumentation wherever a covered library already exists, then layer manual spans in wherever business logic, custom retrieval, or evaluation signal crosses a boundary auto-instrumentation can't see. Most production systems end up running both at once, and that's by design, not a compromise.
The OTel Collector as the privacy and routing control layer
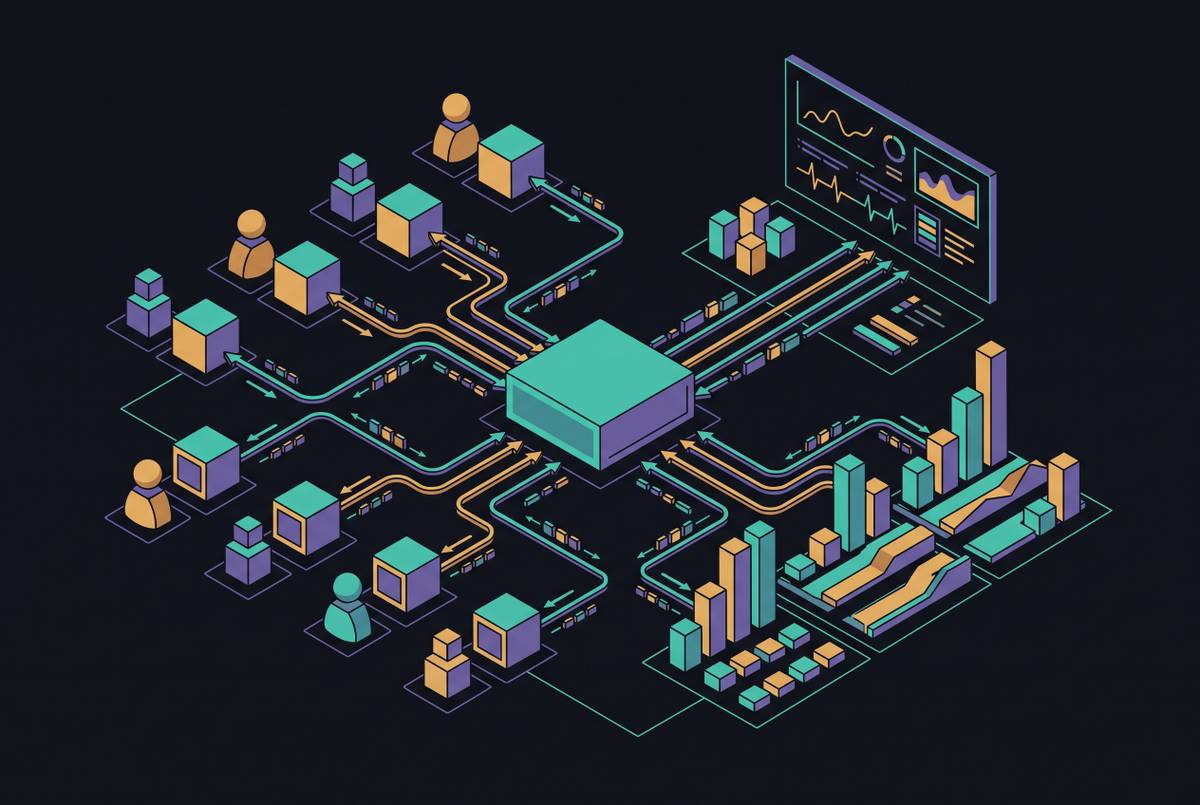
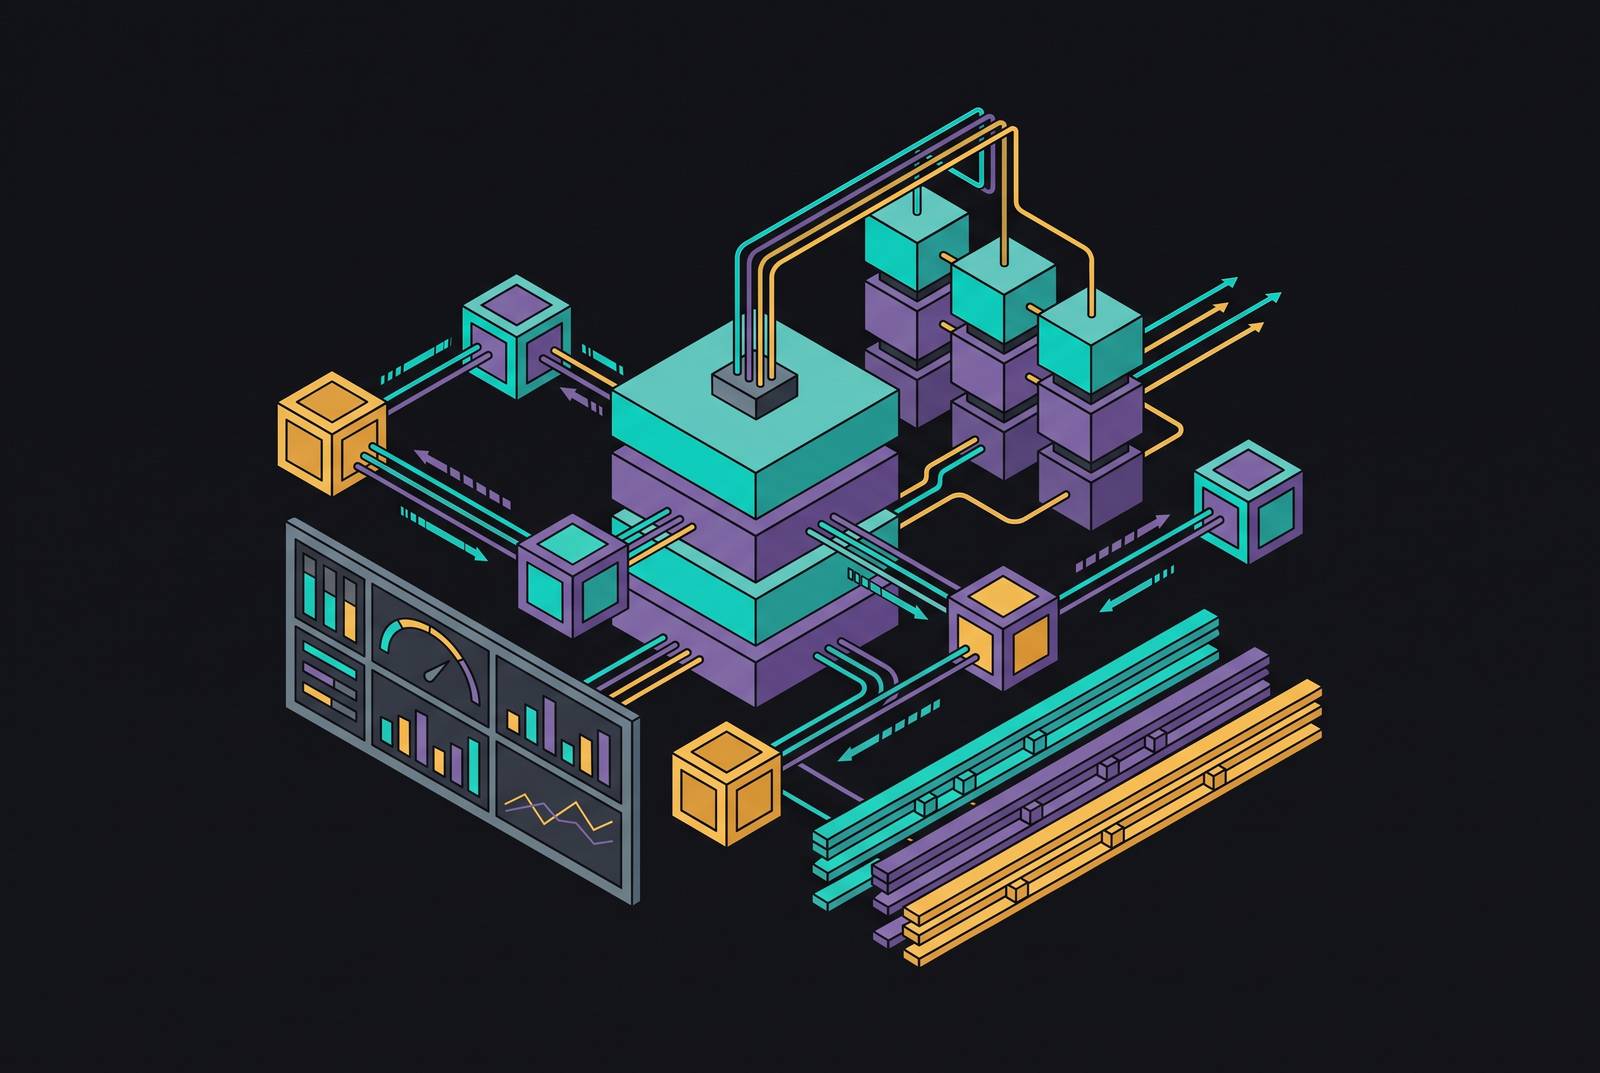
The pipeline shape is simple to draw: an application with the OTel SDK sends signals to the OTel Collector, and the Collector fans them out to whatever backends handle traces, metrics, and logs respectively. The interesting part is what happens inside that middle box.
Prompt and completion content can be filtered or dropped at the Collector level without touching a single line of application code, which is precisely the architectural reason span events are the preferred place to record prompt text rather than span attributes: events can be stripped out at the Collector in a way that's cleaner and more centralized than trying to sanitize every service's instrumentation individually. PII redaction, secret scrubbing, and content cleanup happen once in the pipeline, not scattered piecemeal across every microservice that happens to call an LLM. Span enrichment, tagging things with environment, team, or cost center metadata, happens at the same layer, keeping the actual instrumentation code in the application itself lean and boring, which is what instrumentation code should be.
Routing is the Collector's other job. It can fan the same signal out to multiple destinations at once, sending an OTel-native backend for engineers debugging a trace, a separate cost analytics store for finance, and a SIEM for security and audit review, all from one pipeline without re-instrumenting anything upstream. Enterprise data residency requirements get enforced in practice here: deciding that prompt content only flows to backends with the right residency guarantees is a configuration decision made once at the Collector, not a policy that every application team has to remember to implement on its own.
What cost and usage telemetry from gen_ai.* spans enables
Per-request cost attribution simply doesn't exist without this instrumentation. gen_ai.usage.input_tokens plus gen_ai.usage.output_tokens on a single span is the smallest unit of measurement everything else gets built from: team-level cost, feature-level cost, session-level cost, all of it rolls up from that one pair of numbers recorded per call.
Once that data exists, a handful of things become possible that weren't before. Cost can be broken down by model, by user, by team, or by product feature, a granularity no invoice from a model provider will ever hand over on its own. Anomaly detection on token spend becomes practical, catching the agent loop that goes sideways and burns through orders of magnitude more tokens than a normal run before anyone would have noticed from the bill alone. Latency gets attributed to an actual cause, a slow retrieval step, an oversized context window, a routing decision that picked the wrong model, instead of getting shrugged off as "the LLM is just slow today." And tracking both gen_ai.request.model and gen_ai.response.model catches the case where a provider silently swaps in a different model version than the one requested, which is a drift problem that's invisible without recording both fields side by side.
Cost is not a side interest here. Grafana's 2025 Observability Survey found that 74% of respondents named cost a top priority. Cost telemetry is not a nice-to-have bolted onto an observability rollout; it is frequently the actual reason a team adopts LLM observability tooling.
There's an audit dimension too, and it's less about cost than about accountability. Agent audit trails have to answer four questions: who authorized this action, what context did the agent have when it made a decision, what did it actually decide, and was that decision consistent with policy. The gen_ai.* span tree is the raw material for answering all four, but only if it's structured well, exported reliably, and retained with enough fidelity to reconstruct the decision later. Collect it badly and none of those four questions get answered when someone finally asks them, usually right after something's already gone wrong.
Sources
- OpenTelemetry for AI Systems: LLM and Agent Observability (2026)
- OpenTelemetry for LLMs: Complete SRE Guide for 2026
- AI Agent Observability - Evolving Standards and Best Practices
- Inside the LLM Call: GenAI Observability with OpenTelemetry
- Observability for Delegated Execution in Agentic AI Systems
- greptime.com
- github.com
- developers.redhat.com